
JCI’s P/E Ratio Compared to Other Stock Markets, Is It Cheap Enough?
- 23 hours ago
- 4 min read
As of the end of the May 2026 report, global stock markets exhibited highly varied valuation movements.
For investors, these fluctuations often raise a crucial question: amidst the current index trajectory, is the Indonesian stock market expensive, or is it actually offering a massive discount? To answer this, we cannot simply guess based on daily price movements or fleeting market sentiments. We need to dissect a key indicator that has always served as a compass for investors and capital market analysts: the Price-to-Earnings (P/E) Ratio.
What Is the Market P/E Ratio?
The market P/E Ratio is fundamentally a reflection of the price investors are willing to pay for every IDR 1 of net profit generated by all the companies within a stock index.
While a single company’s P/E Ratio measures the valuation of a specific business, the market P/E Ratio measures how expensive or cheap the valuation of an entire stock exchange is as a whole. This metric acts as the primary benchmark to gauge the level of market participants’ optimism or pessimism regarding economic growth prospects and the future profitability of listed companies.
How to Calculate the P/E Ratio
Conceptually, the market P/E Ratio is calculated by dividing the total market capitalization (Market Cap) of all listed companies within the index by their combined total net income.
In practice, there are two commonly used approaches: Trailing P/E (using the proven, recorded net income from the past 12 months) and Forward P/E (using projected or estimated future net income). The calculation yields a weighted average level that reflects the aggregate valuation of the exchange.
JCI Valuation Through a Historical Lens: Is it Really Discounted?
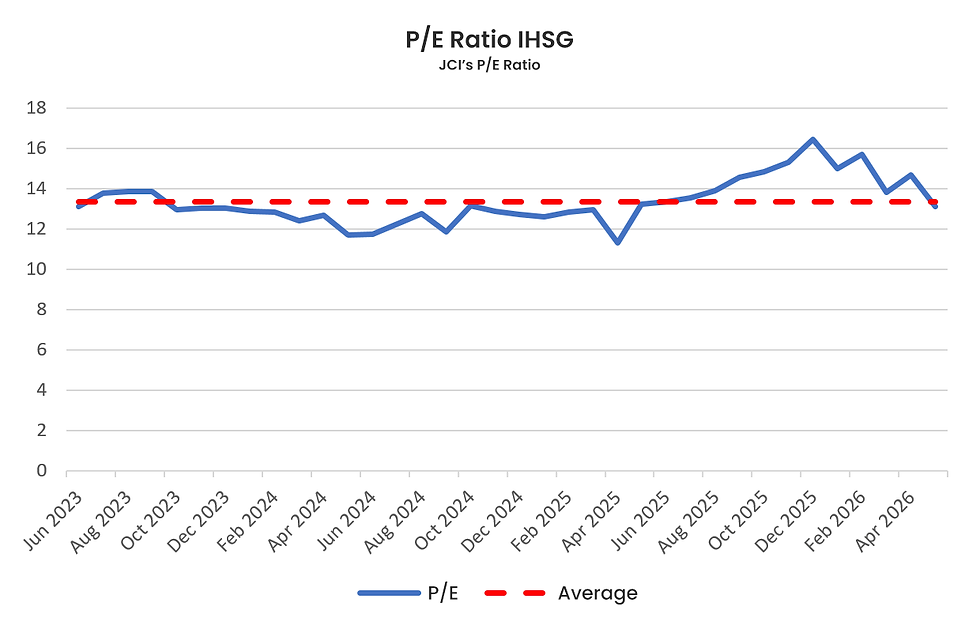
A standalone P/E Ratio figure cannot tell the whole story. An index can only be considered “cheap” if its current level is well below its historical average. If we dissect the track record of the JCI over the past few years, the JCI’s average P/E Ratio stands at 13.35×.
With the Market P/E currently sitting at 13.12× as of the end of May 2026, the figure is confirmed to be below its historical average. Mathematically, a valuation position below the average line validates that the JCI is indeed offering a genuine valuation discount.
Behind the “Cheap” Label: Why Is the JCI Trading at a Discount?
Heavy Foreign Outflows: There has been a massive sell-off and relocation of foreign capital, shifting out of the domestic exchange.
Weakening of the Rupiah: Ongoing depreciation pressure on the Rupiah against the US Dollar directly erodes the returns of foreign investors and burdens corporate fundamentals.
Political and Economic Policy Uncertainty: Domestic political dynamics and market hesitations regarding the future direction of economic policies cause market participants to hold back and adopt a defensive stance.
JCI vs. Wall Street & ASEAN: Which is More Enticing?
Aside from looking backward, whether an index is cheap or expensive is also evaluated through cross-border (cross-exchange) comparisons. The S&P 500 index in the United States currently sits at a valuation of 31.67×. The high valuation of the S&P 500 is heavily buoyed by the dominance of tech giants, where investors are willing to pay a high premium for the expectation of fantastic growth.
Meanwhile, let’s pit the JCI’s valuation against neighboring countries in the ASEAN region (data as of the end of May 2026 as reported by ceicdata.com):
• Malaysia (FTSE Bursa Malaysia KLCI): 17,17×
• Thailand (SET Index): 16,95×
• Indonesia (IHSG): 13,12×
• Filipina (PSEi): 10,22×
From the data array above, the JCI’s position looks highly compelling. Its valuation proves to be significantly cheaper compared to the Malaysian and Thai stock markets, which have already touched the 16–17× range. Although the Philippine exchange records the cheapest figure, the JCI occupies the “sweet spot”. JCI gets a discounted valuation that is supported by macroeconomic fundamentals and highly competitive daily transaction liquidity levels in Southeast Asia.
However, when drawing comparisons, one must always remember that the JCI's characteristics are heavily influenced by the weighting of major banking issuers and the commodity sector, which naturally have more conservative valuation standards compared to exchanges heavily populated by the technology sector.
Conclusion
Based on the valuation distribution map as of the end of May 2026, the 13.12× figure proves that the JCI is offering a valuation discount that is hard to ignore, both when compared to developed country exchanges and those of fellow ASEAN nations.
A temporary downturn during the first half of 2026 presents a golden opportunity to accumulate quality assets below their fair value. Instead of merely taking a wait-and-see approach, utilizing this momentum to buy stocks with solid fundamentals as a foundation for long-term investment, while maintaining our portfolio diversification, is a wise strategy.
Disclaimer: This content is created for educational purposes or service promotion, and does not constitute a recommendation to buy or sell any specific Securities. Any risks arising from investment decisions made based on the information in this publication are the sole responsibility of the respective audience. PT KAF Sekuritas Indonesia is licensed and supervised by the Financial Services Authority (Otoritas Jasa Keuangan / OJK).


Comments